
Projects
Alongside my other academic research, I also work on quantitative questions in financial markets, using public data. Each project is specified in writing before it runs, and its write-up states the question, the data, the method, and the result, including where the result was null, and links to the code so the analysis can be reproduced.
Portfolio construction
Optimal versus naive diversification
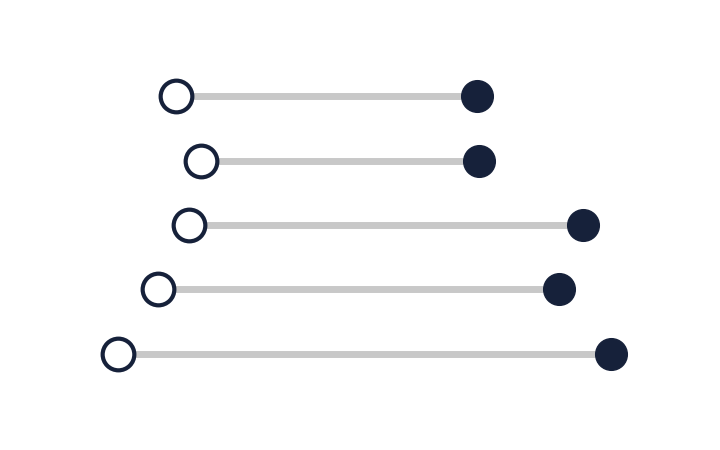
Under an index-tracking mandate on French's 49 industries, five covariance estimators understate their own tracking error, by 22 to 61 per cent. The replication of DeMiguel, Garlappi and Uppal (2009) reproduces 29 of the 30 Sharpe ratios that carry a band.
Ownership and prices
Climate risk as an equity signal
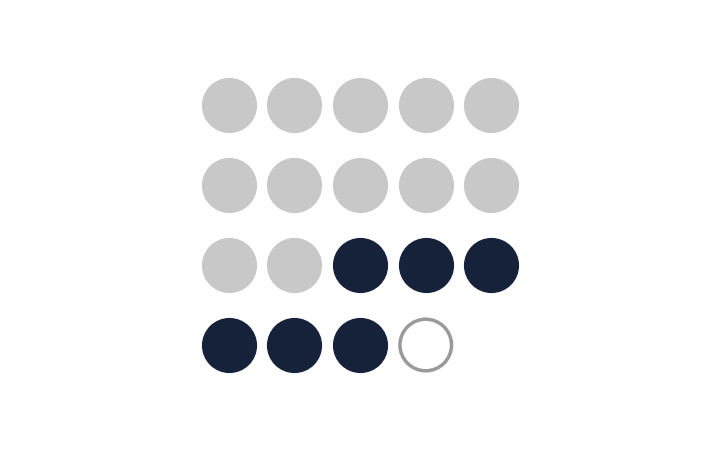
An ownership graph linking 328 listed companies to the 5,115 tracked assets they own. Of 19 apparent ownership changes checked by hand, 12 had no transaction behind them.
Asset allocation
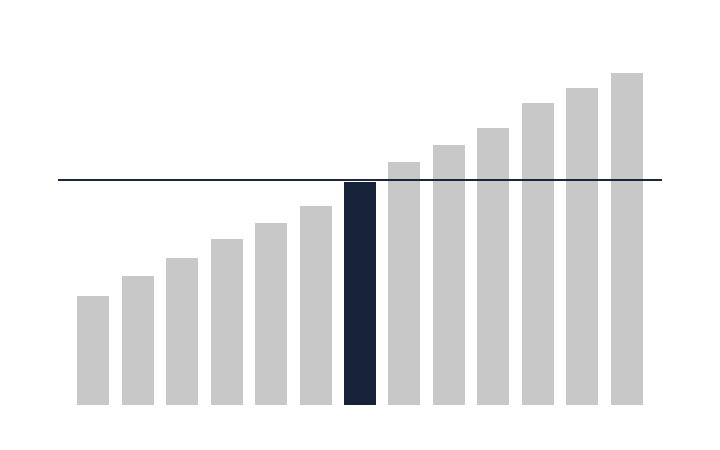
A real-money portfolio at 70/30, global equity and euro government bonds, run under rules fixed before the first order. The split is the largest equity weight whose worst fall from 1999 to 2025 stayed within 35 per cent.
For written analysis aimed at decision-makers, see the two DEMETRA policy briefs under Publications.